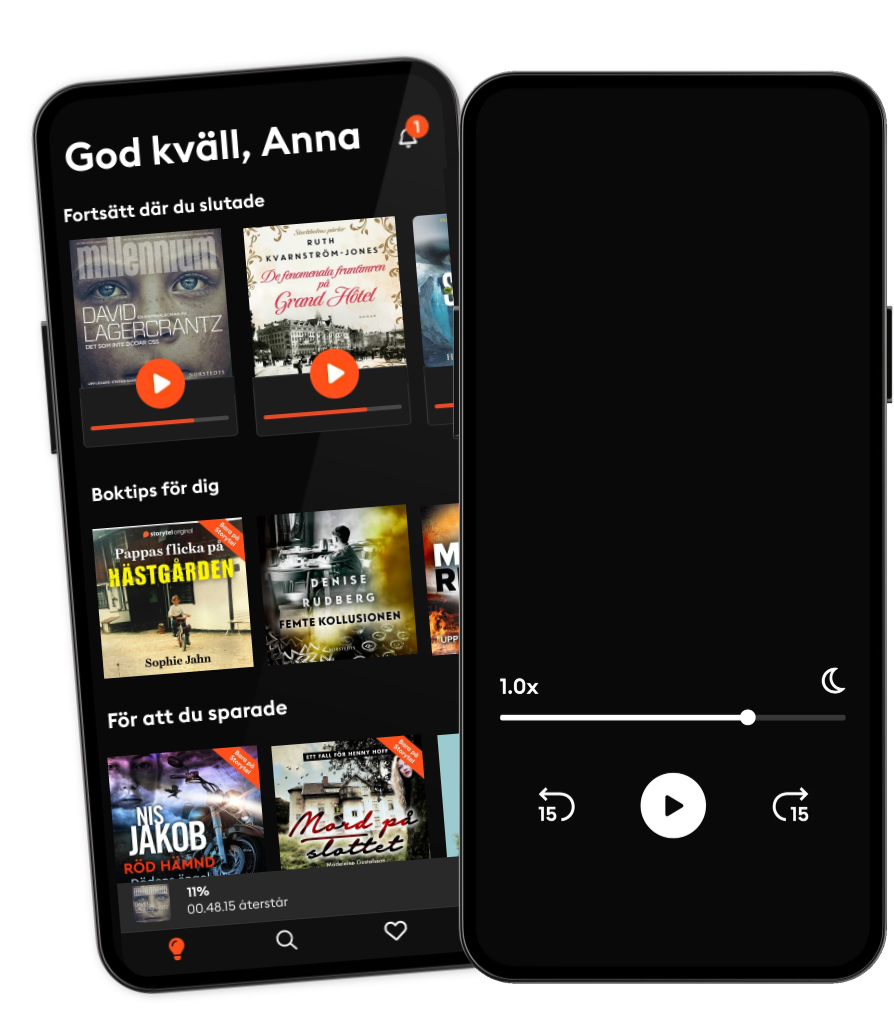
Lyssna när som helst, var som helst
Kliv in i en oändlig värld av stories
- 1 miljon stories
- Hundratals nya stories varje vecka
- Få tillgång till exklusivt innehåll
- Avsluta när du vill
Matplotlib 2.x By Example: Multi-dimensional charts, graphs, and plots in Python
- Språk
- Engelska
- Format
- Kategori
Fakta
Big data analytics are driving innovations in scientific research, digital marketing, policy-making and much more. Matplotlib offers simple but powerful plotting interface, versatile plot types and robust customization.
Matplotlib 2.x By Example illustrates
the methods and applications of various plot types through real world examples.
It begins by giving readers the basic
know-how on how to create and
customize plots by Matplotlib. It further covers how to plot different types of economic data in the form of 2D and 3D graphs, which give insights from a deluge of data from public repositories, such as Quandl Finance. You will learn to visualize geographical data on maps and implement interactive charts.
By the end of this book, you will become well versed with Matplotlib in your day-to-day work to perform advanced data visualization. This book will guide you to prepare high quality figures for manuscripts and presentations. You will learn to create intuitive info-graphics and reshaping your message crisply understandable.
© 2017 Packt Publishing (E-bok): 9781788292139
Utgivningsdatum
E-bok: 28 augusti 2017
- Femte kollusionen Denise Rudberg
4.3
- Den sista utposten Mari Jungstedt
4.1
- Han ägde mig: En sann berättelse om att överleva en mans våld Leone Milton
4.1
- De fenomenala fruntimren på Grand Hôtel Ruth Kvarnström-Jones
4.5
- Sångfågeln Anki Edvinsson
4.1
- Det slutar med oss Colleen Hoover
4.2
- Omega Lina Areklew
3.8
- Sömngångaren Lars Kepler
4.2
- Långfredagen Sofie Sarenbrant
3.8
- Krigarhjärta Lars Wilderäng
3.9
- Olivträdet Lucinda Riley
4.1
- Fyrklövern Micke Hansen
4.3
- Offer i frack Carin Hjulström
4.3
- Sju kvadrat med lås Jussi Adler-Olsen
4.4
- Kanske i morgon Guillaume Musso
4.4
Därför kommer du älska Storytel:
1 miljon stories
Lyssna och läs offline
Exklusiva nyheter varje vecka
Kids Mode (barnsäker miljö)
Flex
För dig som vill prova Storytel.
1 konto
20 timmar/månad
Spara upp till 100 olyssnade timmar
Exklusivt innehåll varje vecka
Avsluta när du vill
Obegränsad lyssning på podcasts
Premium
För dig som lyssnar och läser ofta.
1 konto
100 timmar/månad
Exklusivt innehåll varje vecka
Avsluta när du vill
Obegränsad lyssning på podcasts
Unlimited
För dig som vill lyssna och läsa obegränsat.
1 konto
Lyssna obegränsat
Exklusivt innehåll varje vecka
Avsluta när du vill
Obegränsad lyssning på podcasts
Family
För dig som vill dela stories med hela familjen.
2-6 konton
100 timmar/månad för varje konto
Exklusivt innehåll varje vecka
Avsluta när du vill
Obegränsad lyssning på podcasts
2 konton
239 kr /månadSvenska
Sverige
